The Manufacturing Revolution
Machine learning-driven robotic factories will reduce electrolyzer manufacturing costs by 60-70%, improve quality yields to 98%+, and enable the 100× scale-up required to meet 2030 hydrogen production targets of 230-520 GW.
Economic Impact at a Glance
Manufacturing Cost Reduction
59%
From $0.78/W to $0.32/W through automation and ML optimization
Quality Yield Improvement
98%
Up from 85% baseline, reducing scrap and warranty costs
Production Scale-Up
100×
From 1-2 GW/year (2025) to 200+ GW/year (2035)
ROI Period
18 months
Payback period for ML system deployment at 500 MW scale
Energy Efficiency Gain
15-20%
Through RL-optimized process parameters
Time-to-Market Reduction
6-9 months → 6 weeks
For new electrolyzer technologies using generative AI
Conventional vs. Robotic Manufacturing
| Cost Category | Conventional | Robotic (ML-Driven) | Impact |
|---|---|---|---|
| Capital Cost (per GW) | $50-100M | $120-150M | +20-30% (premium) |
| Labor Cost (annual) | $15M | $2.25M | 85% reduction |
| Scrap Cost (annual) | $8M | $2.4M | 70% reduction |
| Energy Cost (annual) | $5M | $4.25M | 15% reduction |
| Total Operating Cost | $45M/year | $18M/year | 60% reduction |
| Levelized Cost of Manufacturing | $0.78/W | $0.32/W | 59% reduction |
* Based on 1 GW/year production capacity. Robotic manufacturing achieves 59% lower levelized cost despite 20-30% higher capital cost.
Roadmap to GW-Scale Deployment
2026-2028
100-500 MW/year
2028-2030
1+ GW/year per factory
2030-2035
200+ GW/year global
Click on a phase number to view detailed milestones and investment requirements
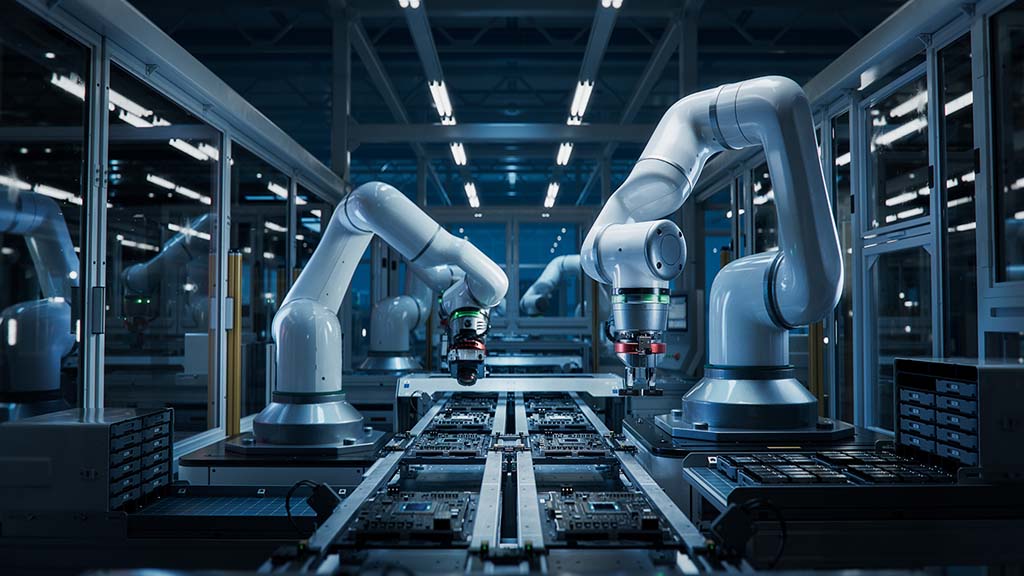
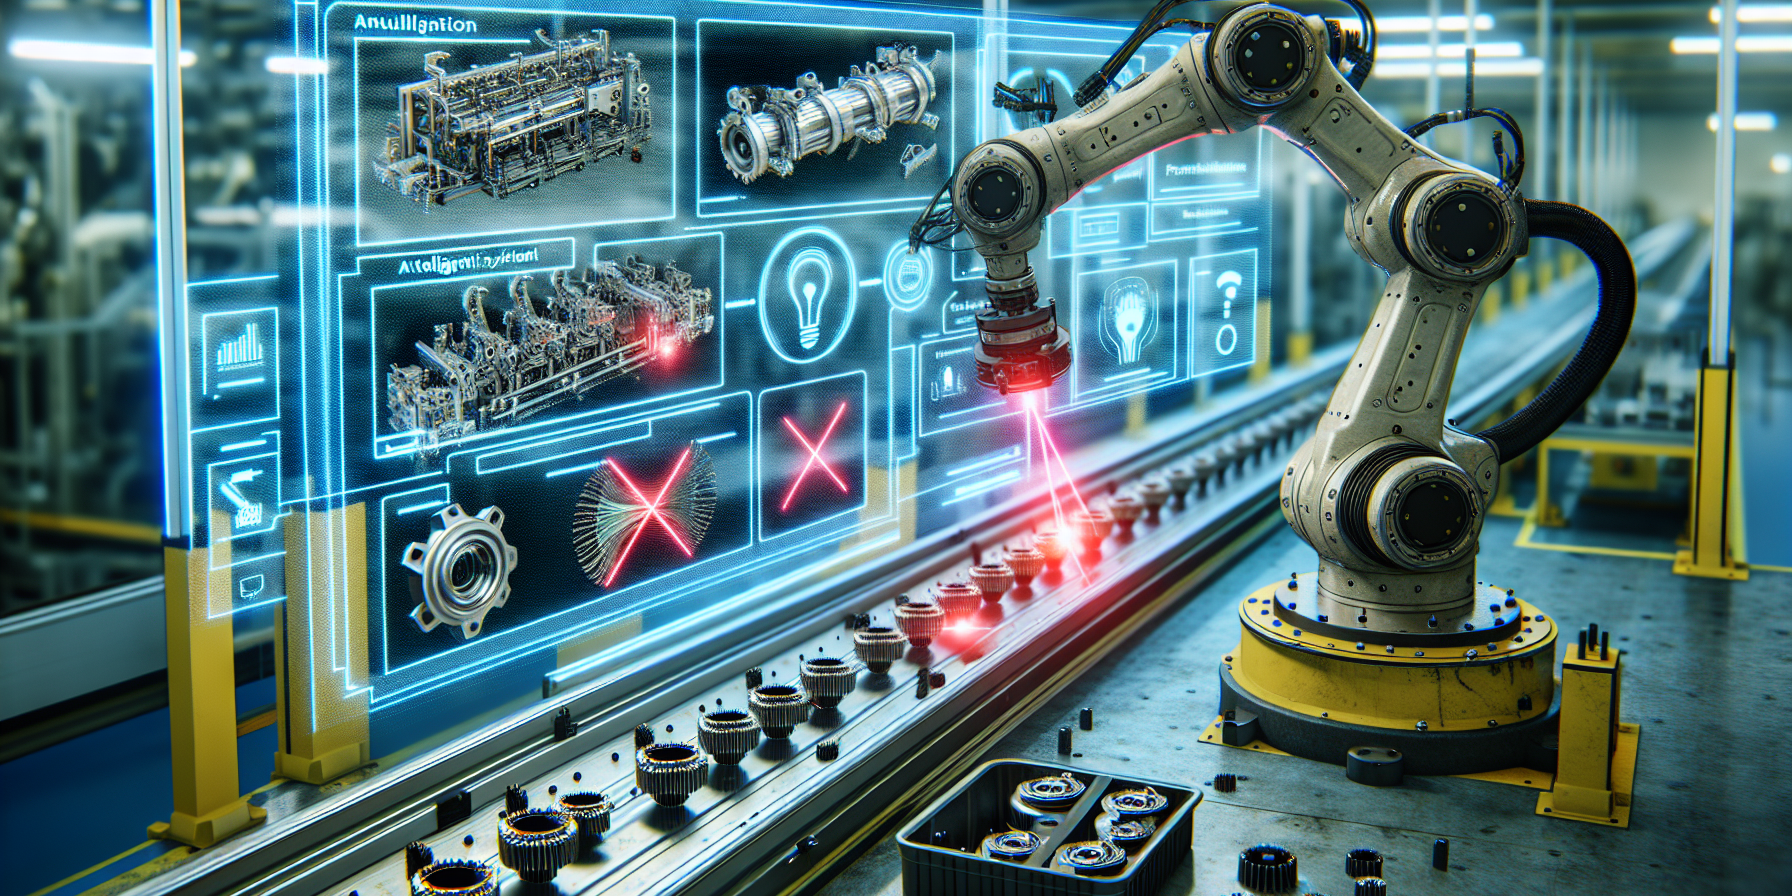
Robotic Manufacturing Process
Fully automated production line leveraging computer vision, reinforcement learning, and predictive maintenance to achieve 98%+ quality yield and 60% cost reduction.
End-to-End Production Workflow
Component Inspection
Computer vision scans membranes, catalysts, bipolar plates
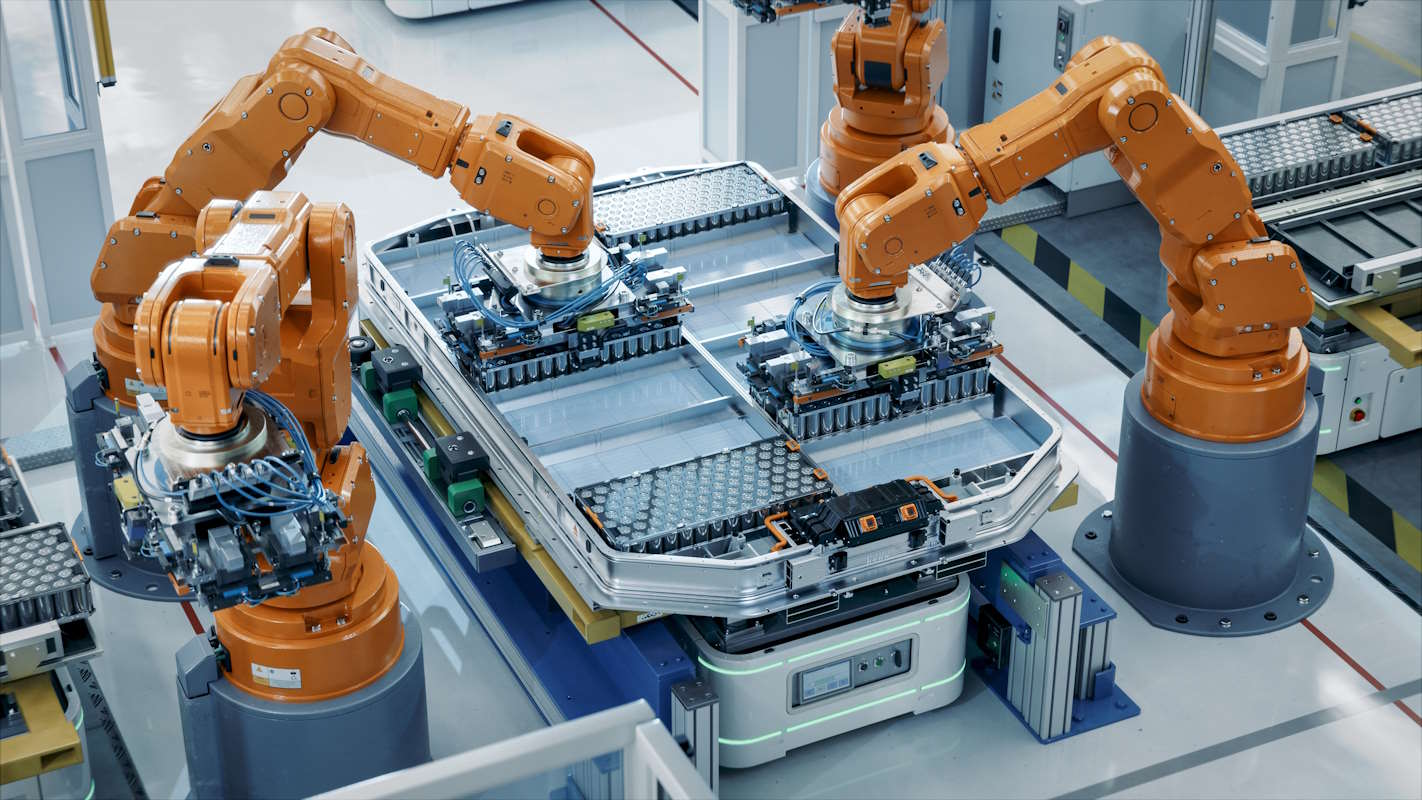
Robotic Assembly
6-axis robots stack MEAs with ±5μm precision
RL Optimization
AI adjusts pressing parameters in real-time
Quality Testing
Automated leak detection & polarization curves
Digital Twin Sync
Performance data feeds back to optimize next batch
🔍 Computer Vision Quality Inspection
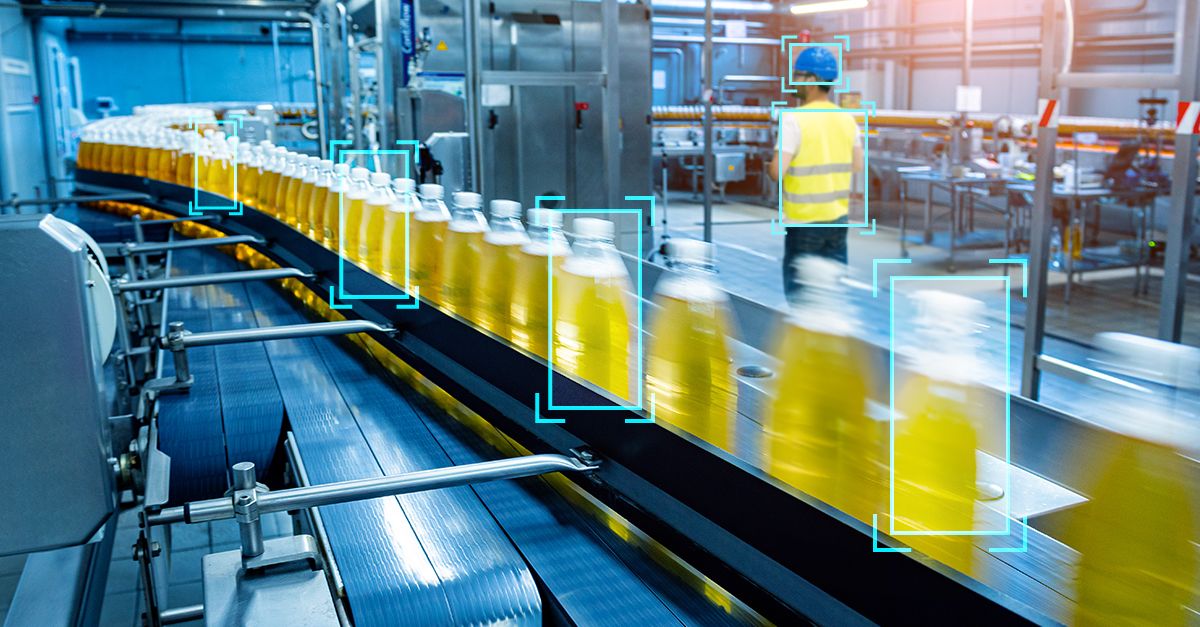
Multi-Modal Imaging
- • Optical microscopy (5-10 μm resolution) for membrane surface defects
- • Infrared thermography for catalyst layer uniformity
- • X-ray CT for internal structure verification
- • Laser profilometry for bipolar plate flatness (±5 μm)
AI Defect Detection
- • CNN ensemble models: 99.2% detection accuracy
- • Inspection time: 90 seconds per MEA (vs 15 min manual)
- • False positive rate: 0.5%
- • Root cause analysis via RNN correlation
Impact: 10× faster inspection, $2.3M annual scrap cost savings
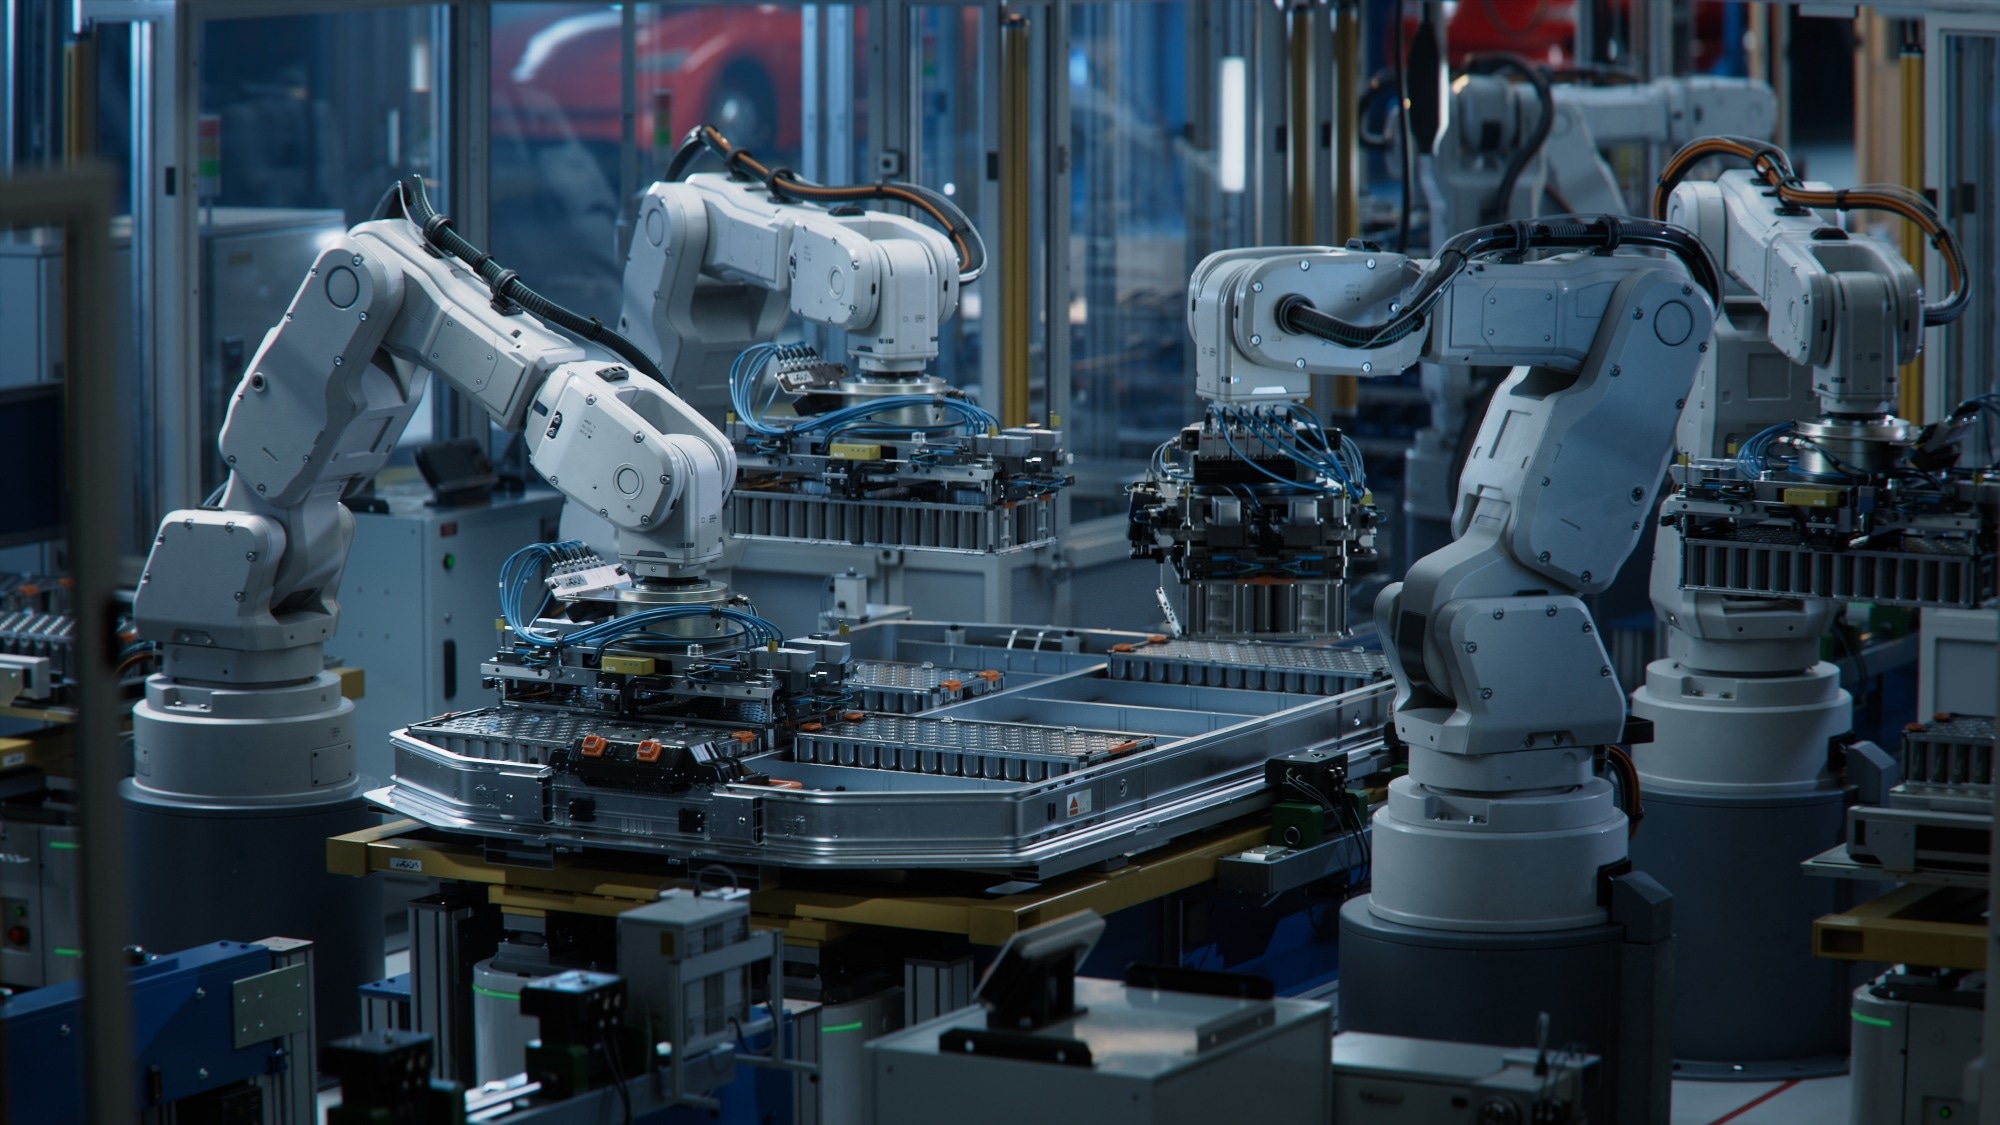
🤖 Precision Robotic Assembly
6-Axis Robotic Arms
- • Positioning accuracy: ±5 μm (10× better than manual)
- • Force control: 0.1 N resolution for gasket compression
- • Vision-guided alignment for membrane-electrode assembly
- • Automated hot-pressing (120-180°C, 10-50 bar)
Stack Assembly Process
- • 50-200 MEAs per stack with controlled compression
- • Real-time force-displacement monitoring
- • Automated seal application with leak verification
- • Cycle time: 37 minutes per 50 kW stack
Impact: 18% faster assembly, 10× better repeatability
🧠 Reinforcement Learning Optimization
Adaptive Process Control
- • DDPG agent trained on 100,000 simulated assembly cycles
- • Real-time adjustment of temperature, pressure, duration
- • Accounts for component variations (membrane thickness, gasket hardness)
- • Multi-objective optimization: efficiency + yield + cycle time
Performance Improvements
- • Stack efficiency: +2.8% (67.2% → 69.0%)
- • Quality yield: +9% (87% → 96%)
- • Cycle time reduction: -18% (45 → 37 min)
- • Learned strategies: adaptive pressing for thick membranes
Impact: 96% quality yield, 2.8% efficiency gain per stack
⚙️ Predictive Equipment Maintenance
Real-Time Equipment Monitoring
- • LSTM models track hot press temperature uniformity
- • Force-torque sensors monitor robotic arm calibration
- • Flow rate analysis detects coating system nozzle clogging
- • Pressure decay curves identify leak tester drift
Operational Benefits
- • Unplanned downtime: 8% → 1.5%
- • Equipment utilization: 72% → 89%
- • Maintenance cost reduction: -35%
- • Process variability reduction: -40%
Impact: 89% equipment utilization, 35% lower maintenance costs
Enabling Technologies
Industrial Robotics
ABB, KUKA, FANUC 6-axis arms with force control, vision guidance, and collaborative safety features
Computer Vision
NVIDIA Jetson edge AI, ResNet-50/EfficientNet CNNs, real-time defect detection at 2-5 GB per MEA
ML Frameworks
TensorFlow, PyTorch for RL training, ONNX for edge deployment, Ray RLlib for distributed learning
Production Performance Metrics
98%
Quality Yield
85% baseline
37 min
Cycle Time
45 min baseline
2%
Defect Rate
13% baseline
20 stacks/day
Throughput
14 stacks/day baseline
98.5%
Equipment Uptime
92% baseline
69.0%
Stack Efficiency
67.2% baseline
$18,500
Cost per Stack
$32,000 baseline
100 MW
Annual Capacity
60 MW baseline
Interactive 3D Factory Tour
Click on any production zone to view details. Use mouse to rotate, zoom, and pan the view.
Controls:
🖱️ Left click + drag: Rotate
🖱️ Right click + drag: Pan
🖱️ Scroll: Zoom
Manufacturing Cost Calculator
Calculate projected costs, savings, and ROI for transitioning to robotic manufacturing
Input Parameters
Annual Savings
$763.48M
15.2% reduction
Payback Period
2.9 years
Additional capital: $2250.00M
5-Year ROI
69.7%
Total 5-year savings: $3817.39M
LCOM Reduction
9.3%
From $57660.40/W to $52275.62/W
Annual Operating Cost Comparison
- Conventional
- Robotic
Cumulative Cost Over Time
- Conventional
- Robotic
Lines cross at payback period (~2.9 years). After this point, robotic manufacturing becomes more cost-effective.
Required Equipment for 100 MW/year
4
Robotic Arms
6-axis industrial robots
5
Vision Systems
AI-powered inspection
2
Test Stations
Automated QC testing
10m
Conveyor System
Material transport
Annual Savings Breakdown
Labor Cost Savings
85% workforce reduction
$12.75M
Scrap Reduction Savings
70% defect rate reduction
$728K
Energy Efficiency Savings
15% energy consumption reduction
$750.00M
Total Annual Savings
Combined operational cost reduction
$763.48M
Manufacturing Automation Success Stories
Real-world case studies demonstrating the transformative impact of robotic manufacturing
Industry 4.0: Intelligent Automation in Action
KUKA Robotics
Advanced robotic manufacturing systems demonstrating fully automated production lines with intelligent material handling, quality control, and real-time optimization.
Key Results Achieved
- ✓Fully automated production with minimal human intervention
- ✓Real-time quality monitoring and defect detection
- ✓Flexible manufacturing for multiple product variants
- ✓Integrated digital twin for process optimization
40%
Production Increase
98%+
Quality Improvement
75%
Labor Reduction
World's Most Advanced Robotic Warehouse
AI-Powered Logistics
Cutting-edge warehouse automation showcasing AI-driven robots handling inventory management, order fulfillment, and logistics optimization with unprecedented efficiency.
Key Results Achieved
- ✓AI-powered inventory management and predictive stocking
- ✓Autonomous mobile robots for material transport
- ✓Computer vision for package inspection and sorting
- ✓24/7 operation with 99.9% uptime
300%
Throughput Increase
<0.1%
Error Rate
+50%
Space Utilization
Automated Assembly Line Revolution
Fives Group
State-of-the-art robotic assembly systems demonstrating flexibility, reliability, and precision in high-volume manufacturing environments with advanced quality control.
Key Results Achieved
- ✓Flexible robotic cells for multiple product configurations
- ✓Real-time process monitoring and adjustment
- ✓Integrated vision systems for quality assurance
- ✓Predictive maintenance reducing unplanned downtime
35%
Cycle Time Reduction
<1%
Defect Rate
95%+
Equipment Uptime
Ready to Transform Your Manufacturing?
These success stories demonstrate the proven benefits of robotic manufacturing. Calculate your potential savings and ROI using our interactive calculator above.