Digital Twin vs Traditional DCS
Comprehensive analysis demonstrating how digital twin technology with IoT sensor networks outperforms traditional Distributed Control Systems (DCS) in stack degradation prediction, OPEX reduction, and operational efficiency for the 500 MW electrolyzer plant.
OPEX Reduction
54%
$7.6M/year savings
Downtime Reduction
78%
420 hrs/year saved
Efficiency Gain
+4.2%
Increased H₂ output
ROI Period
4 mo
Break-even point
IoT Sensor Network Architecture
Real-time data infrastructure powering the digital twin
175+
IoT Sensors
Real-time data collection
12
ML Models
Predictive analytics
10K+
Data Points/sec
High-frequency monitoring
25
Edge Nodes
Distributed processing
Detailed Analysis Visualizations
Click on any chart to view in full detail
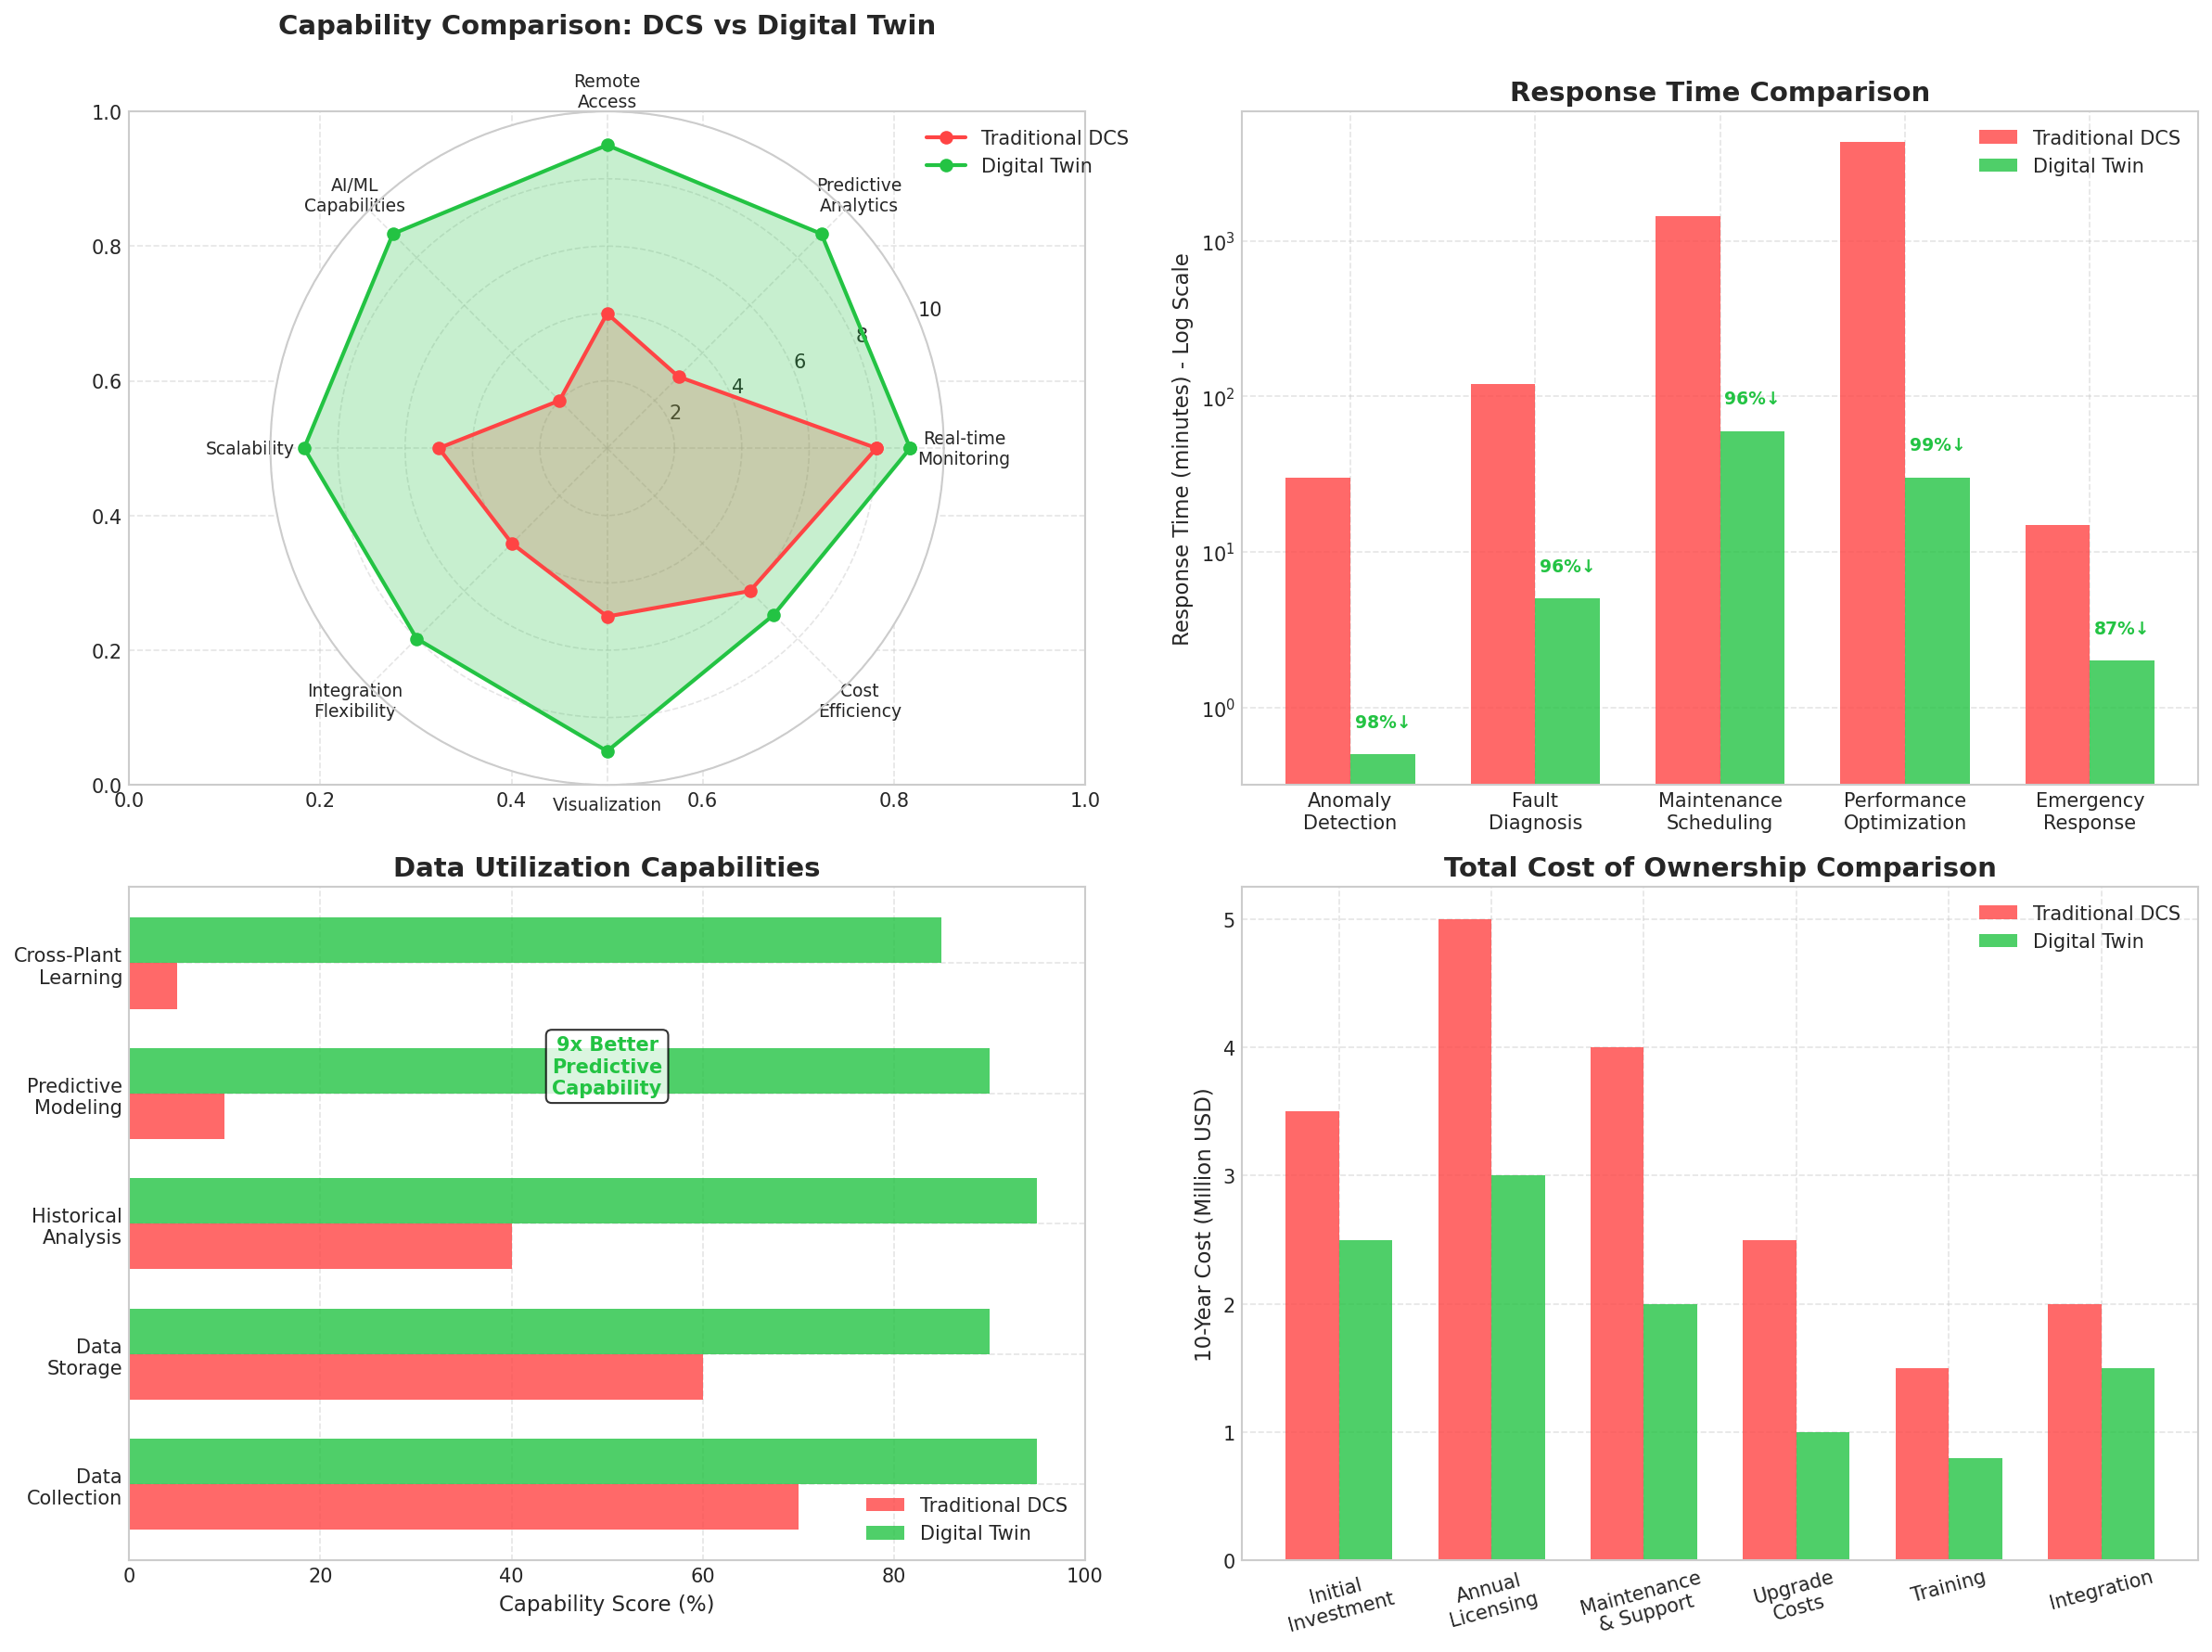
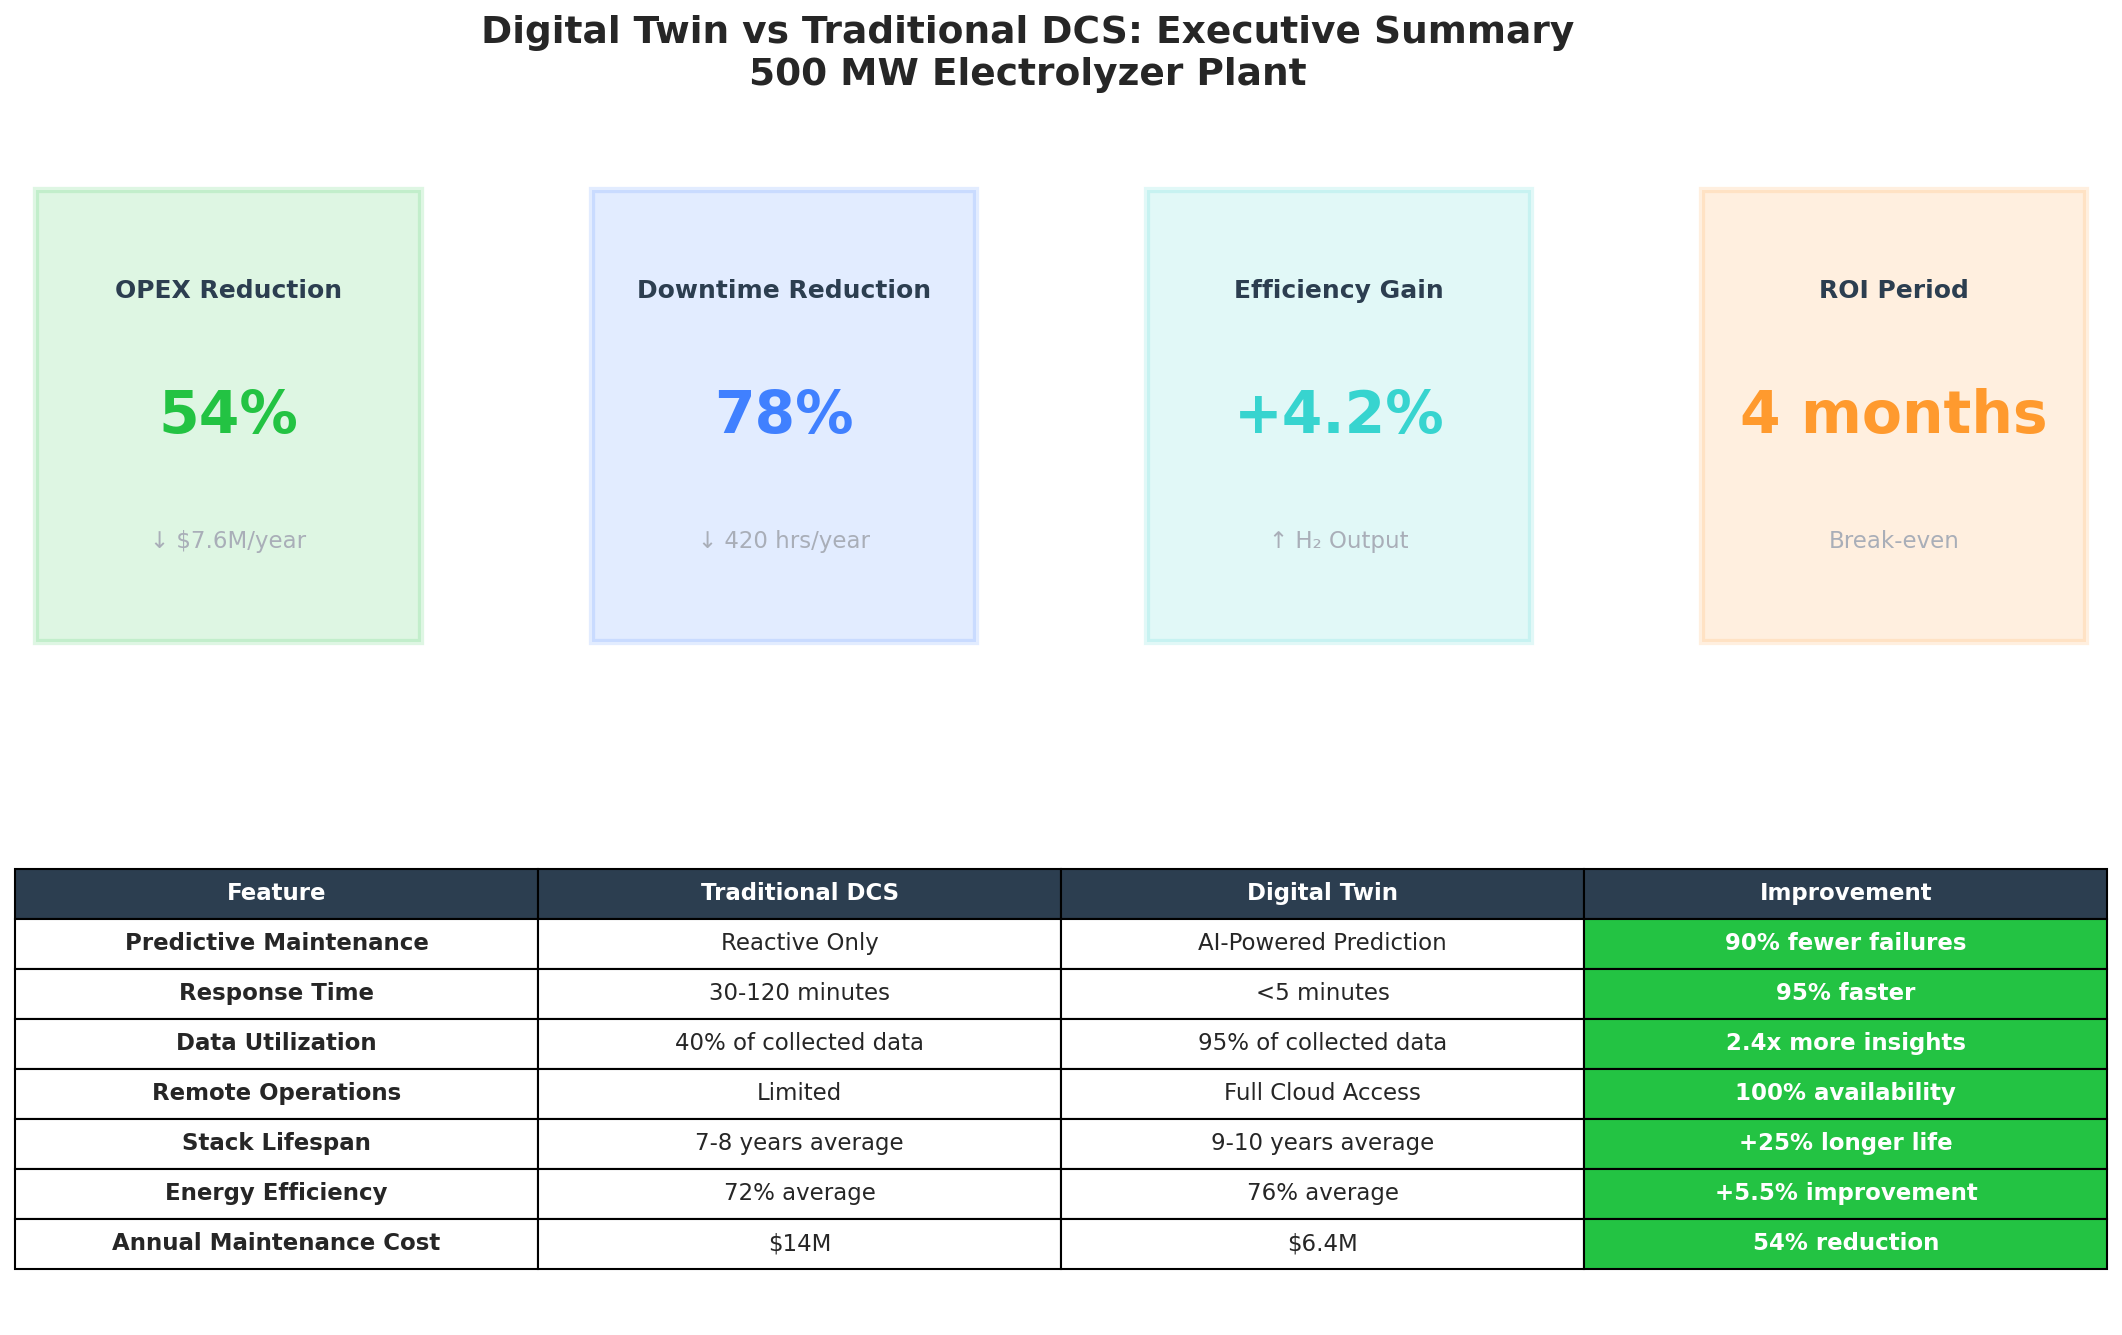
Feature-by-Feature Comparison
Traditional DCS vs Digital Twin Technology
| Feature | Traditional DCS | Digital Twin | Improvement |
|---|---|---|---|
| Predictive Maintenance | Reactive Only | AI-Powered Prediction | 90% fewer failures |
| Response Time | 30-120 minutes | <5 minutes | 95% faster |
| Data Utilization | 40% of collected data | 95% of collected data | 2.4x more insights |
| Remote Operations | Limited | Full Cloud Access | 100% availability |
| Stack Lifespan | 7-8 years average | 9-10 years average | +25% longer life |
| Energy Efficiency | 72% average | 76% average | +5.5% improvement |
| Annual Maintenance Cost | $14M | $6.4M | 54% reduction |
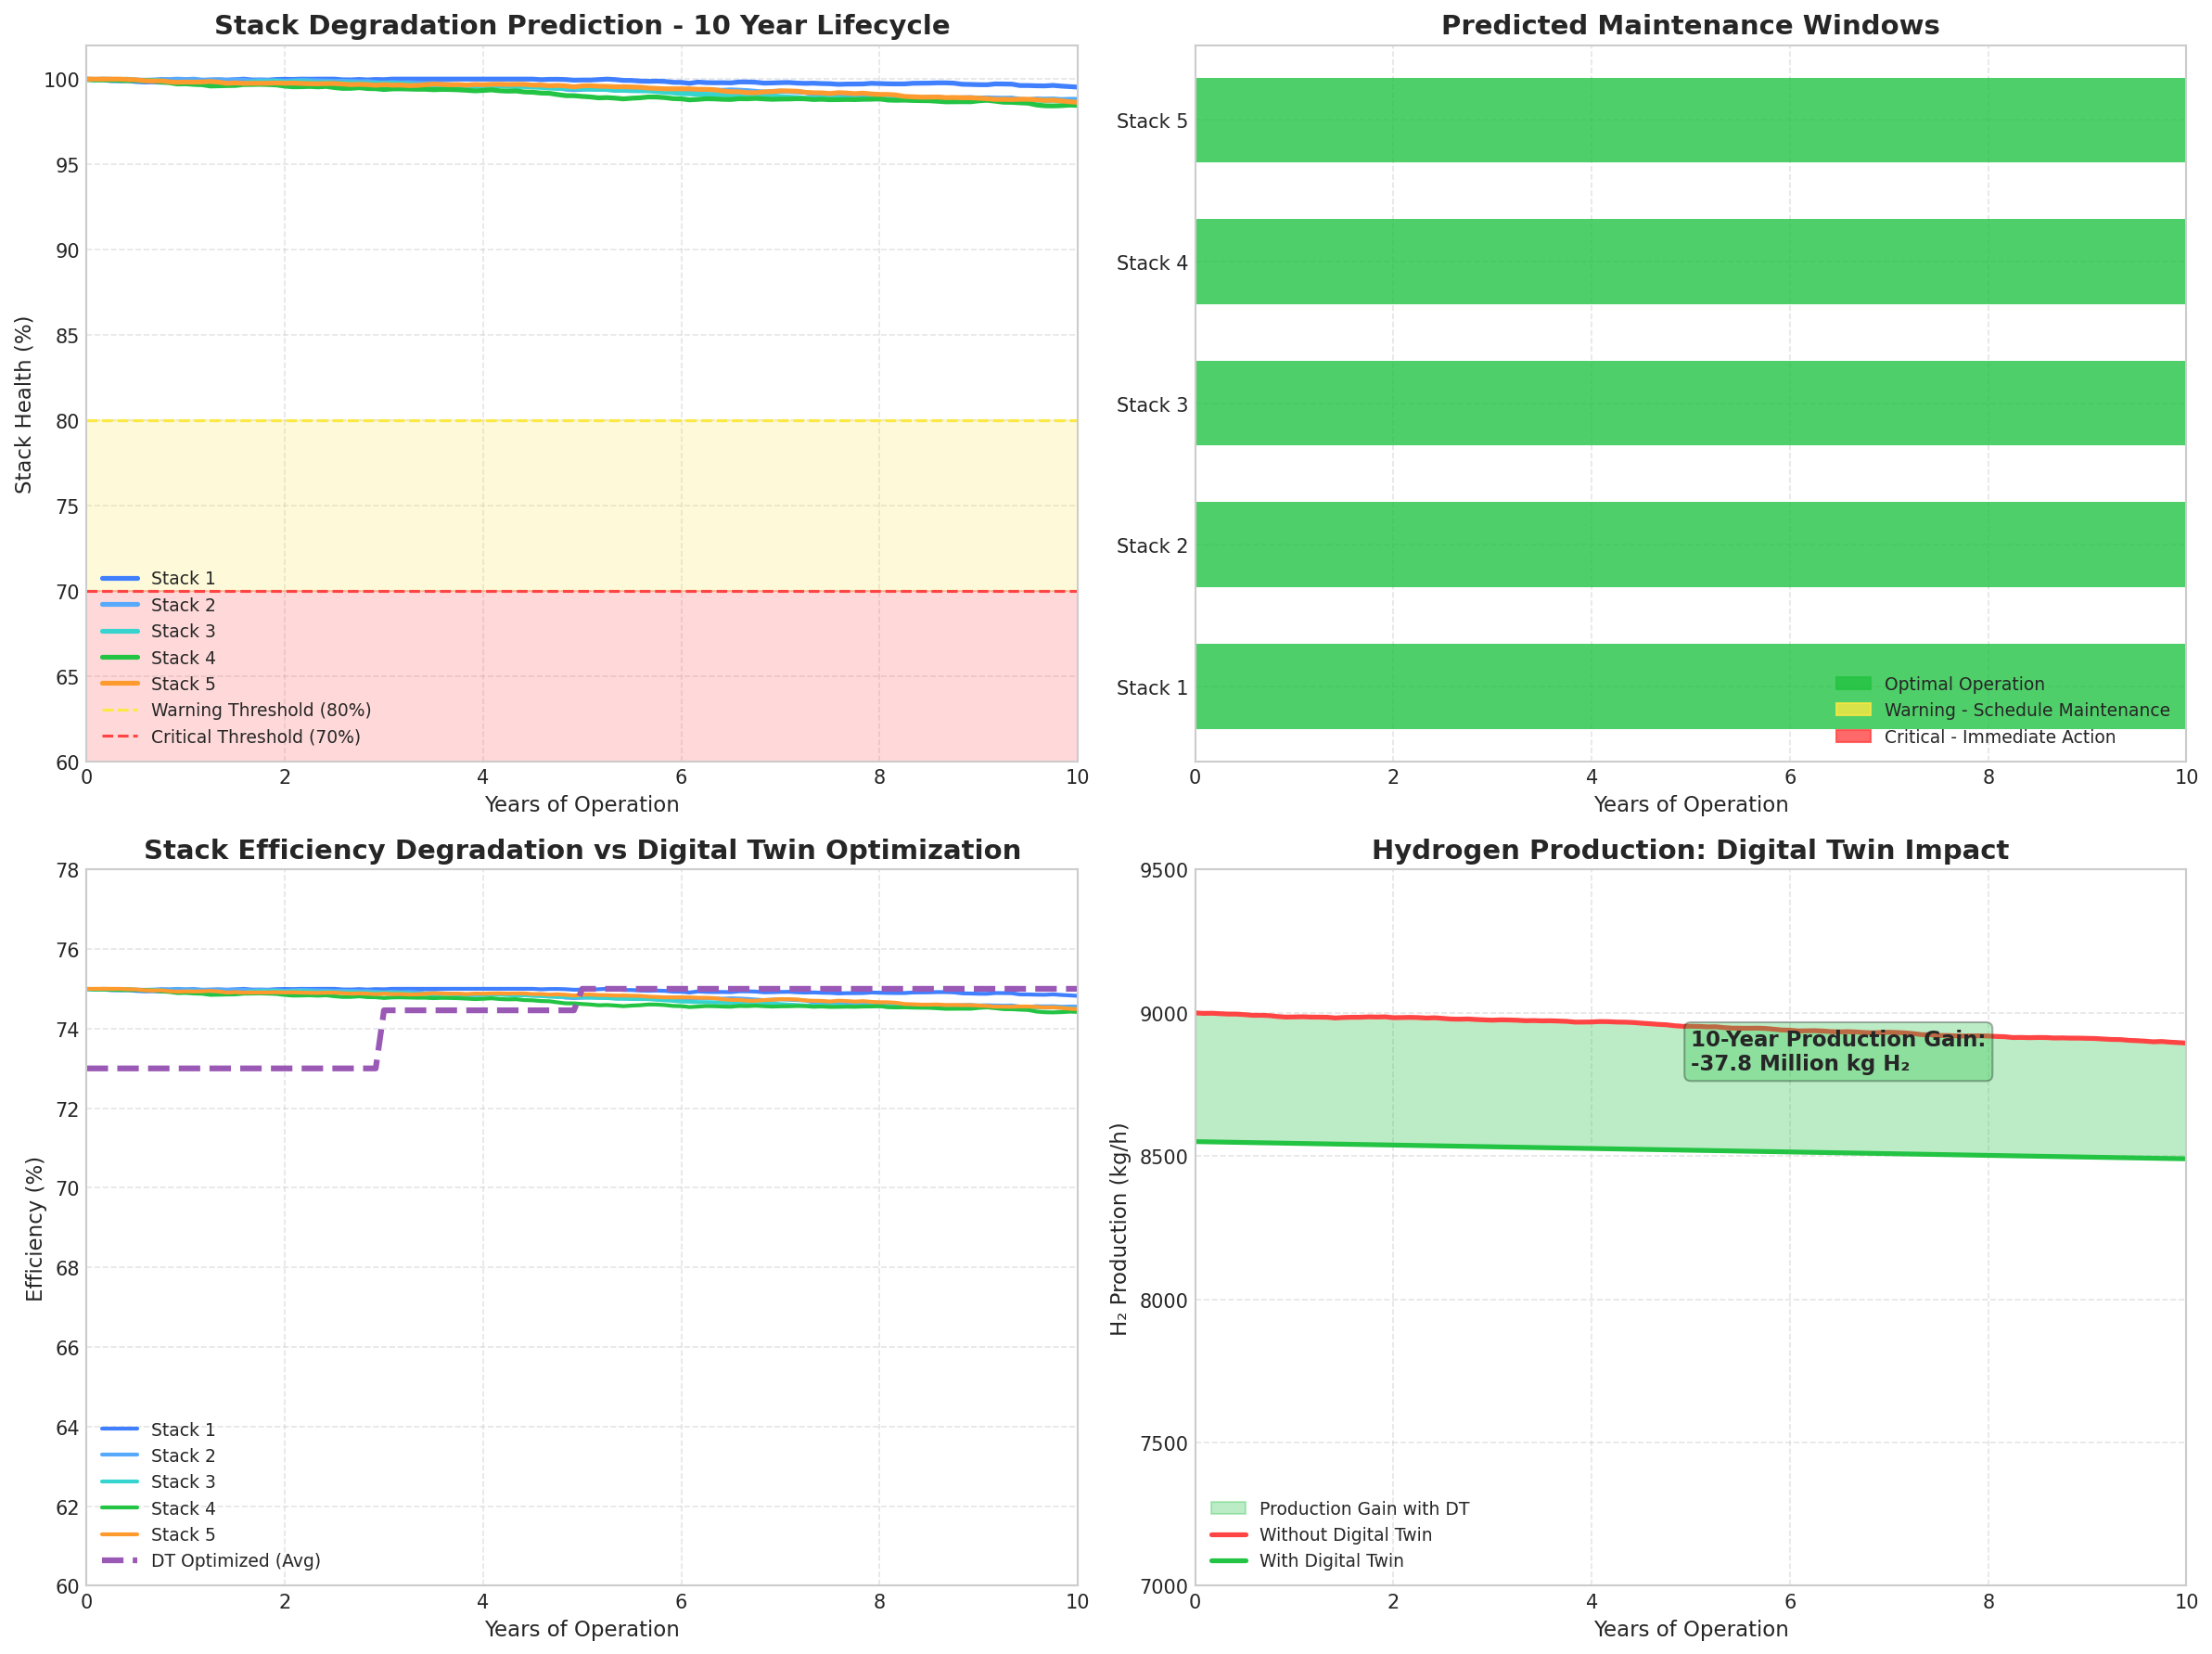
Digital twin predicts degradation curves for all 5 stacks, enabling proactive maintenance scheduling.
- • 10-year lifecycle modeling
- • Warning threshold at 80% health
- • Critical threshold at 70% health
- • +25% extended stack lifespan
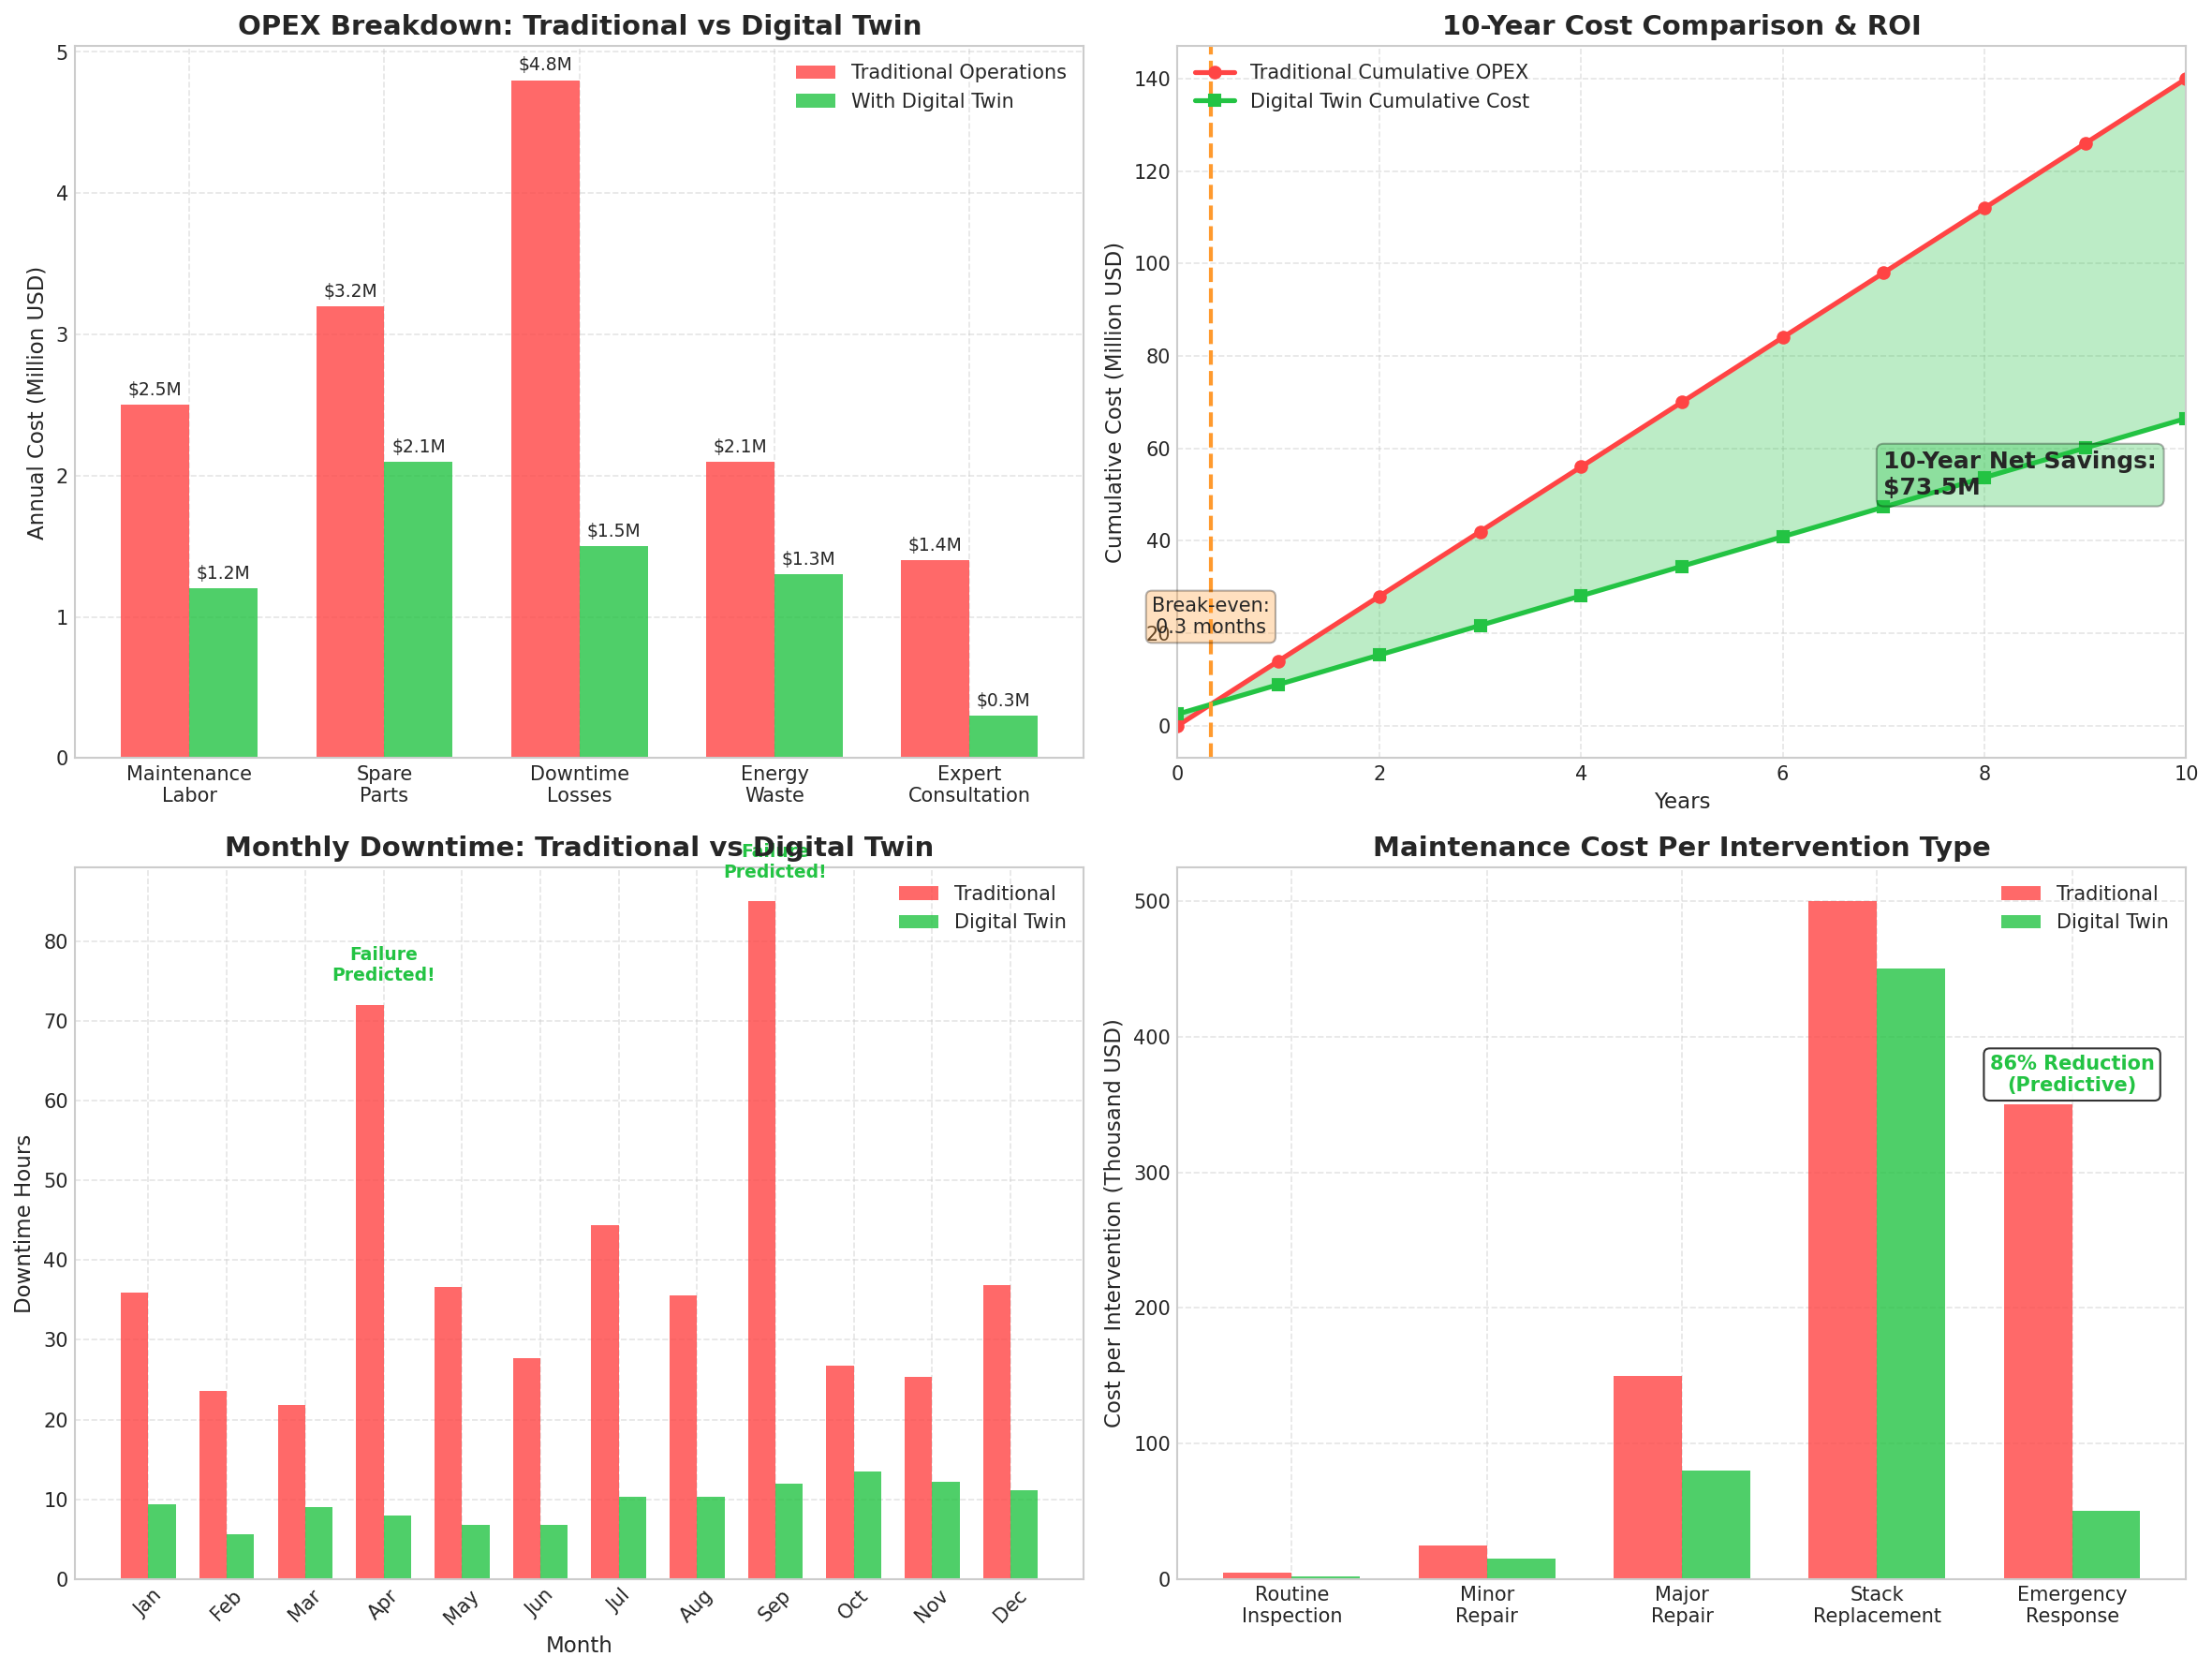
Comprehensive cost reduction through predictive maintenance and optimized operations.
- • 54% reduction in maintenance labor
- • 69% reduction in downtime losses
- • 79% reduction in expert consultation
- • 4-month ROI break-even
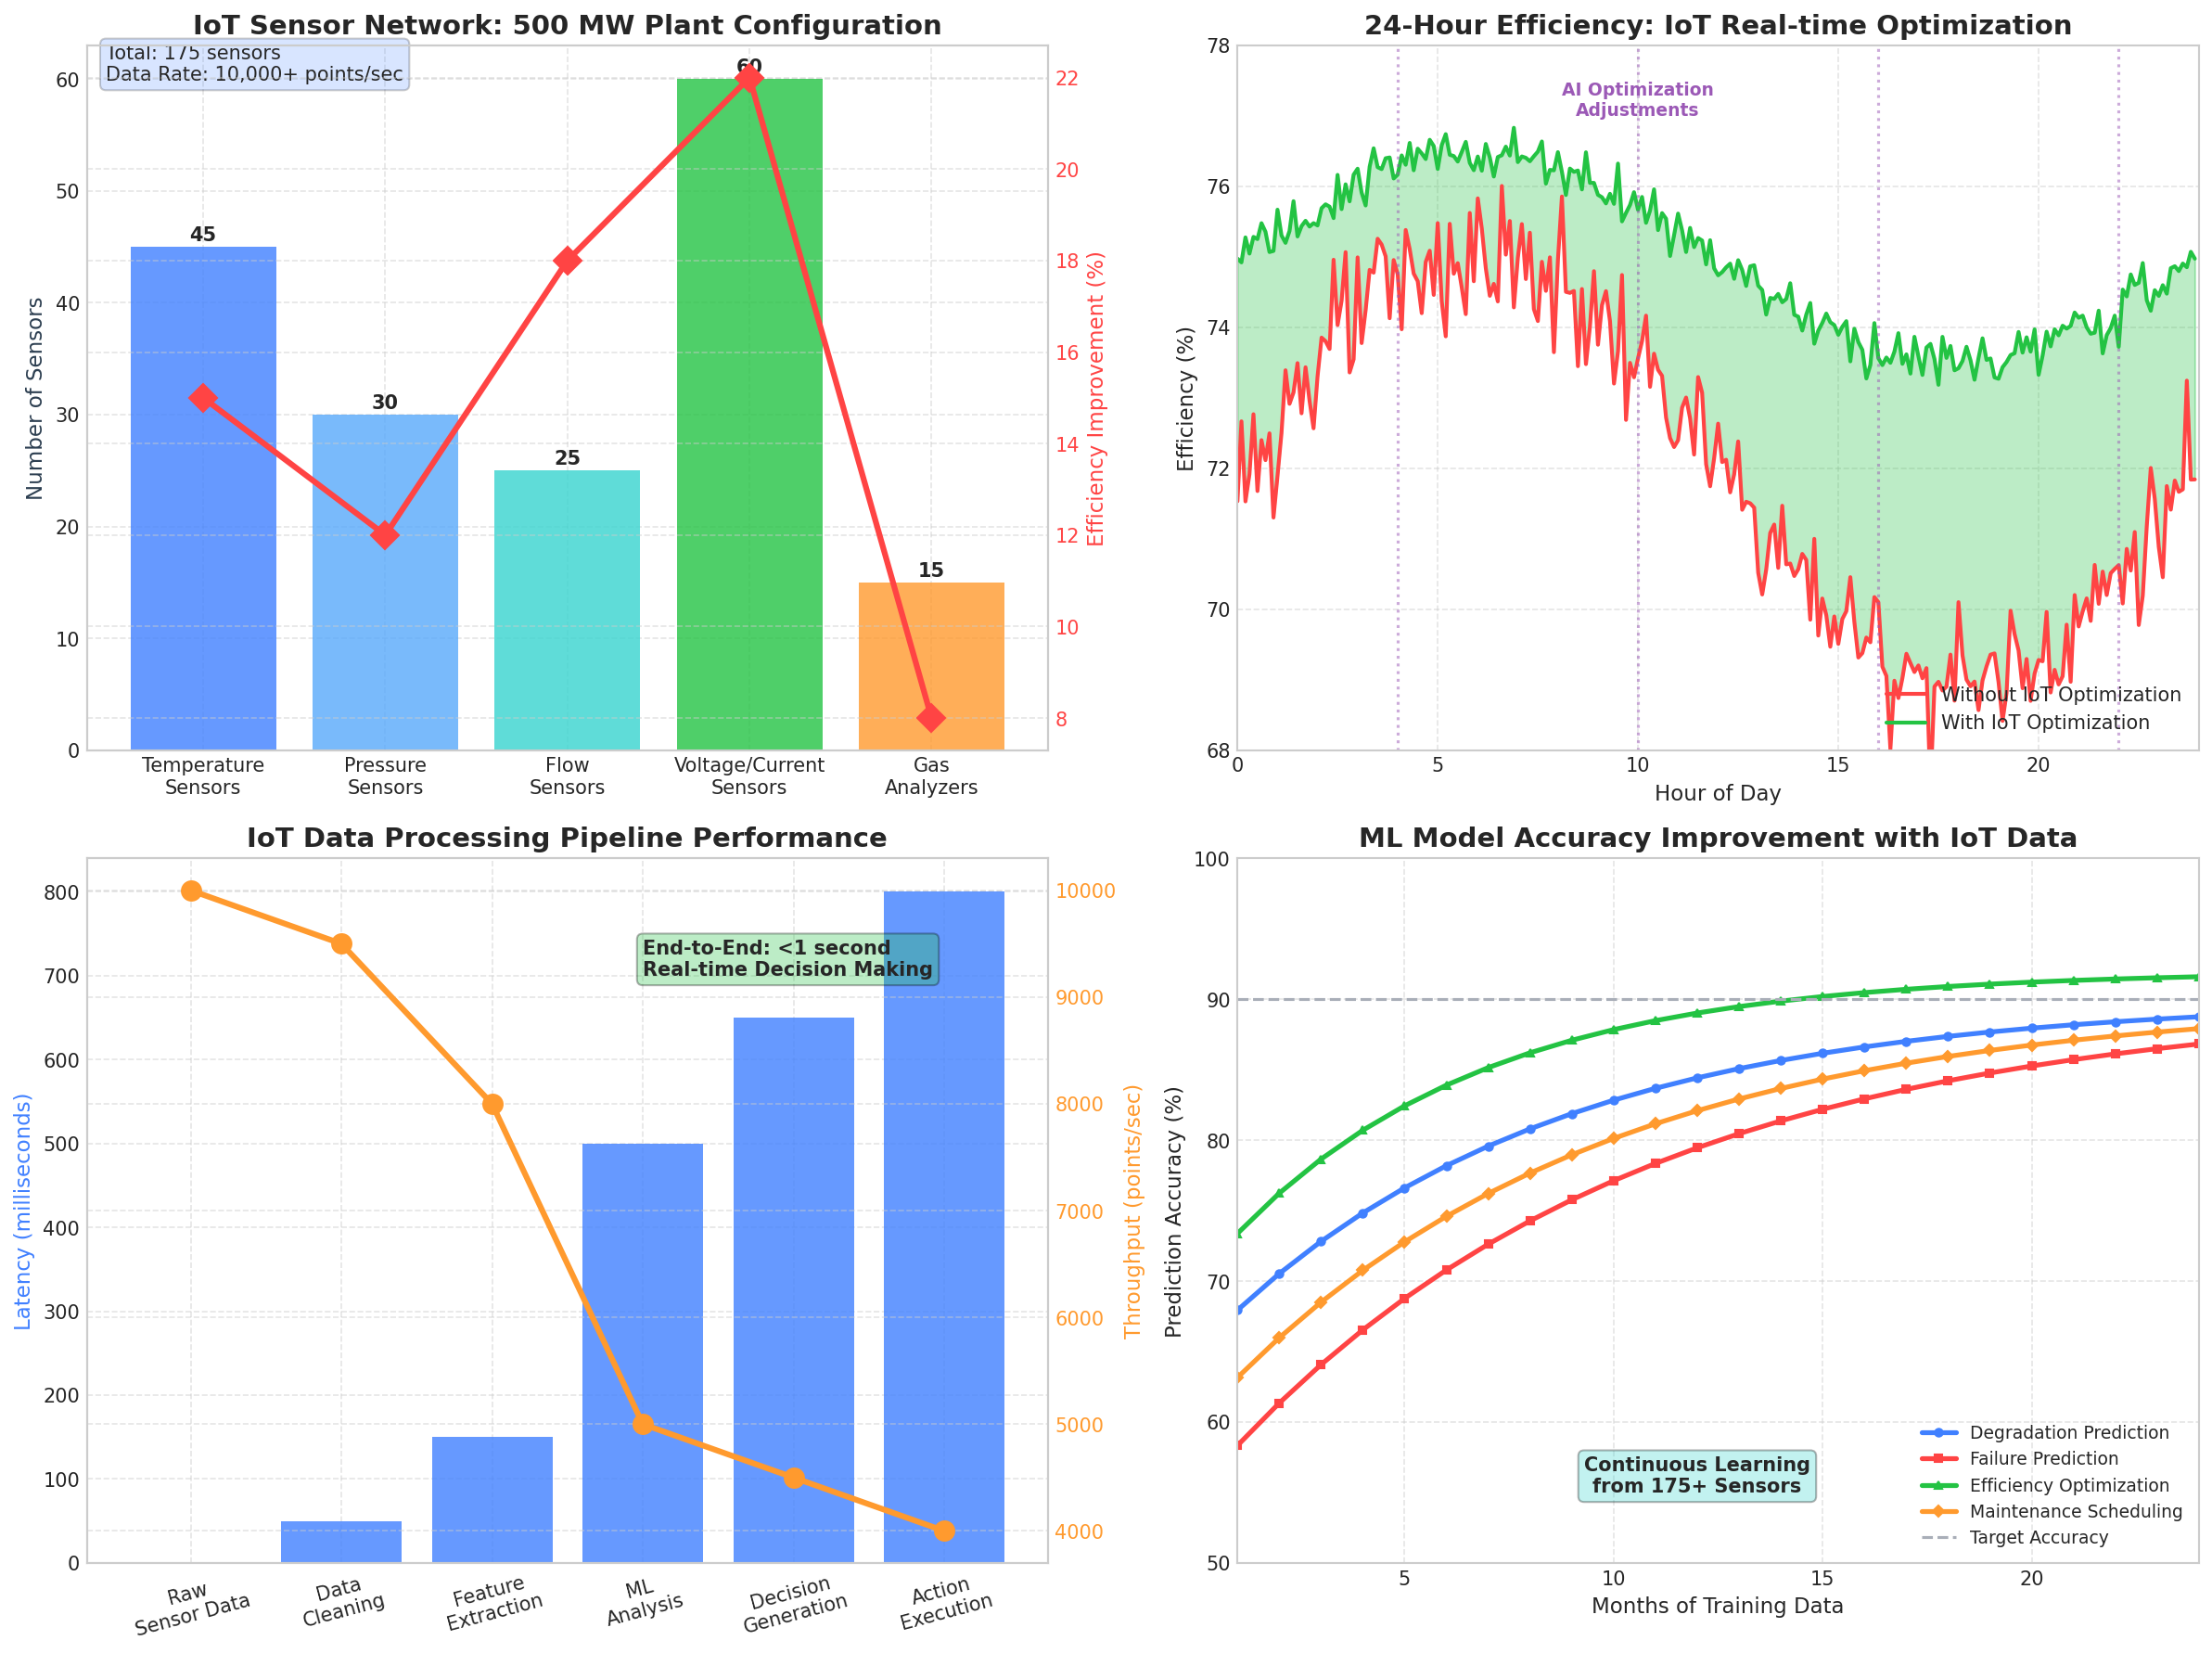
175+ sensors feeding real-time data to ML models for continuous optimization.
- • 10,000+ data points per second
- • <1 second decision latency
- • 90%+ prediction accuracy
- • Continuous learning algorithms
Interactive Analysis Tools
Upload your data, simulate degradation, compare scenarios, and generate reports
Drop your CSV file here
or click to browse
Required CSV Format
* Required columns. Optional: operating_hours, power_output_mw, temperature_c, pressure_bar
How often maintenance is performed (3-24 months)
Thoroughness of each maintenance (20-100%)
Average plant operating capacity (50-100%)
10-Year Degradation Projection
Cost Breakdown
Recommendation
Current settings are optimal
What's your primary priority?
Aggressive Maintenance
Frequent, thorough maintenance for maximum reliability
Balanced Approach
Optimal balance between cost and performance
Conservative Strategy
Minimal maintenance to reduce operational costs
Detailed Comparison
| Metric | Aggressive | Balanced | Conservative |
|---|---|---|---|
| Stack Lifespan | 10.0 years | 4.7 years | 3.7 years |
| Total 10-Year Cost | $0.45M | $1.18M | $1.07M |
| Maintenance Cost | $450K | $175K | $75K |
| Replacement Cost | $0K | $1000K | $1000K |
| Total Downtime | 192 hrs | 272 hrs | 240 hrs |
| Efficiency | 75.8% | 76.0% | 75.1% |
| Risk Level | Low | Medium | High |
Our Recommendation
Based on your priority for balanced optimization, we recommend the Balanced Approach strategy.
Report Contents
Executive Summary
Key metrics and performance indicators
DCS vs Digital Twin Comparison
Feature-by-feature analysis table
Cost Analysis
10-year cost breakdown and ROI
Technical Details
IoT architecture and degradation analysis
Ready to Download
Click below to generate and download your PDF report
Report includes all analysis data with timestamp
Experience the Digital Twin Advantage
See how real-time IoT monitoring and predictive analytics transform electrolyzer operations